
Activity Diagram for Course Registration System
The UML activity diagram shows how the activities of a credit card processing system work together. It is one way to keep track of behavior, activities, and the development of software.
Additionally, the activity diagram uses symbols to define the overall workflow of the course registration system. It is composed of activities, decisions, and paths (flows).
Course Registration System Activity Diagram: Details
The table shows the project details of the activity diagram for course registration system. It has the complete details of the project.
| Name: | Course Registration System Activity Diagram |
| Abstract: | The course registration system Activity Diagram represents the behavior of the project in terms of its activities. It contains the important details on the activities and constraints done in the project. |
| UML Diagram: | Activity Diagram |
| Users: | School Admin, Authorized Registrar Personnel, and Students or Registrees. |
| Tools Used: | Diagram tools that provide activity diagram symbols. |
| Designer: | Sourcecodehero.com |
What is Course Registration System?
A course registration system allows students to be registered in the course of their choice. Compared to signing up for a course by hand, the online registration form is simple and quick to fill out. So, it saves both time and money.
As well, the course registration system helps students find out what they need to know about a course and sign up for it. With this method, you don’t have to fill out paper forms by hand and mail them to a registration office. This way, the student can sign up whenever they want and quickly send in their information online.
Define Course Registration System Activity Diagram
UML calls an activity diagram for a course registration system a very useful activity diagram. This picture shows how the system and clients talk to each other. This is done by giving them different levels of detail about how the system works.
The activity diagram in UML describes the processes in a use case diagram. Its’ illustration can also be sequential or concurrent. It is one of the Credit Card Processing System UML diagrams.
Further, the activity diagram can explain complicated use cases (use case diagrams) to make any process easier and better. It shows how the system works, what it does, and how it does it.
Importance of UML Activity Diagram
When you use an activity diagram, you do the big things that make up the project’s workflow. These things depend on what the user decides, which makes the interaction work better. It also shows how a course registration system works by showing a set of actions or control flows.
In UML, the Course Registration System’s main tasks and rules are shown in an activity diagram. Then, these activities make a flow that should be part of the project. Each activity was correctly labeled so that the system’s behavior could be figured out.
The activity diagram is one of the UML diagrams that make up the Course Registration System. It also shows how the system changes over time. It shows how messages move from one task to the next.
Activity Diagram: Benefits
The Activity Diagram Benefits are as follows:
- Using an Activity Diagram, you can see how an algorithm works.
- It also talks about the steps a UML use case goes through.
- A process or workflow shows how users and the system work together.
- Clarify hard use cases to make a process easier to follow and better.
Course Registration System Activity Diagram
The Course Registration System Activity Diagram example goes into more detail about the ideas behind the system. This example of an activity diagram with swimlanes is shown in detail to help programmers understand.
It figures out what a user does when they login to a system. This example shows some of the things that happen when you book something online. So, the focus here was on the actions and choices that were made.
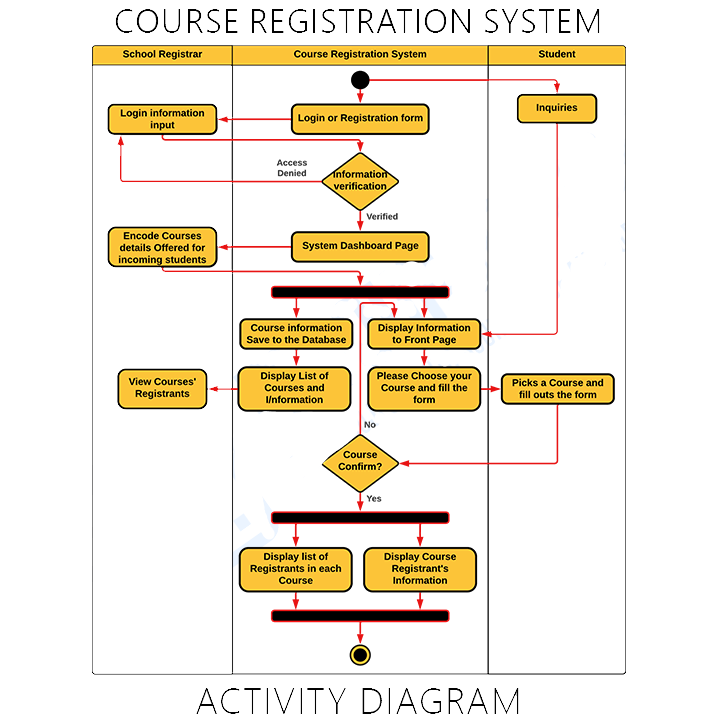
As illustrated, we utilized the swimming lane with three partitions. The left portion displays the lane for the school registrar. It addresses all conceivable registrar actions when utilizing the system. Its container also represents the extent of employee control.
The right partition serves as the designated student lane. This lane illustrates the scope and activity of the students.
Now, the scope and operations of the system are located in the middle. This is done to demonstrate that the system serves as an intermediary between the registrar and the student. Therefore, both the student and the registrar have access to the system.
For users to access the system, their accounts must be logged into the software. The focus was then placed on the functions as the activities flowed and the system and users communicated.
You can add more to this, and it is up to you how you will create your activity diagram. But, make sure that you have precise information and include the important decisions (actions).
Activity Diagram for Course Registration System Pdf
The Activity Diagram can be downloaded as a PDF by clicking the icon below. It contains complete information and debate about the System’s Activity Diagram. You can also edit its content to meet the requirements and specifications of your project.
What are the Symbols used in Activity Diagram?
Activity Diagram Symbols – Not only are they used to build an activity diagram, but also to highlight the role of each component in the system’s process. Each symbol represented a distinct component of the system.

- Start – is the beginning of the action. It uses a filled circle symbol to show its function.
- Action – is a stage of an activity in which users or software accomplish a certain task. Action is shown in Round-edged rectangles.
- Decision – symbolizes a conditional branch in the flow. It has two or more outputs and a single input. A diamond symbol presents this notation.
- Swim Lanes – are the lanes showing the actor’s boundaries. The activities drew in the same lane considered as the organization’s activities. Swim lanes must be in a logical arrangement.
- Activity Flow – is another name for the connectors in the diagram that illustrate the flow between processes (activity).
- End (Terminator) – is the last phase of the activity. An indicated black circle represents the final node.
Each of these activity diagram symbols shows the overall system behavior. Emphasizing the system’s behavior would also be much easier by using these Activity Diagram symbols.
How to Draw an Activity Diagram?
Time needed: 5 minutes
Here are the steps in developing (designing) the activity diagram for course registration system.
- Step 1: Familiarize Activity Diagram Symbols
To create an activity diagram, you must first become familiar with the symbols used. The symbols permit discussion of the system’s activity and interaction flow. Additionally, programmers may rapidly convey the system’s concept to users.
- Step 2: Identify the flow of actions.
After becoming familiar with the symbols, you will need to determine the action sequence. The action flow would be determined by your use case diagram.
When a user initiates the course registration system, actions describe the process or series of events that occur. In an activity diagram, the action also represents a single unit of functionality. In addition, it details the steps in a UML use case diagram.
Data control flow is specified by the incoming and outgoing activity edges of actions. When all of the input conditions are met, its actions commence. - Step 3: Add the Actors (users) involved.
Actors perform their actions on objects, converting them into new objects or altering their state. This actor is a third-party entity that interacts with the system.
We put labels on the swimlanes that say “actors” to show that the action or step was done by them or by the system. This way, readers and developers will be able to see how the system will behave or how it will interact with actors or the other way around. - Step 4: Trace the flow of activities.
To figure out how things work, you need to know that flows can be run, branch, or sequential.
Action or control flows help developers figure out how to move from one state of activity to another. In this notation, there could be more than one action flow coming in or going out.
Also, the flow of activity is set by the control flow, and the inbound arrow starts a single activity step. After this step is done, the flow keeps going in the direction of the outgoing arrow. Object flow also talks about how objects (data) move through an activity.
Conclusion:
In conclusion, we’ve reviewed the definition of an Activity Diagram for Course Registration System and the methods required to create one. This activity diagram is one of the techniques for developing a system for course registration.
Additionally, an activity diagram stresses the system’s flow of activities and the interactions between the users and the system.
Therefore, utilizing an activity diagram in UML will not only allow you to comprehend the project, but also reveal its design possibilities. This diagram functions optimally in conjunction with the other UML Diagrams offered in the Recommended Articles. See also additional Activity Diagrams in the Articles Related section below.
Related Articles:
Inquiries
If you have inquiries or suggestions about Activity Diagram for Course Registration System, just leave us your comments below. We would be glad to hear to concerns and suggestions and be part of your learning.
Keep us updated and Good day!