
Activity Diagram for Student Enrollment System
The UML activity diagram for student enrollment system is a diagram that presents the flow of system activities. It is one of the methods used to document the system behavior in terms of activities and development.
Additionally, the activity diagram uses symbols to define the overall workflow of the student enrollment system. It is composed of activities, decisions, and paths (flows).
Student Enrollment System Activity Diagram: Details
The table shows the overall details of the activity diagram for student enrollment system. It discusses the complete information about the project.
| Name: | Student Enrollment System Activity Diagram |
| Abstract: | The Student Enrollment System Activity Diagram represents the behavior of the project in terms of its activities. It contains the important details on the activities and constraints done in the project. |
| UML Diagram: | Activity Diagram |
| Users: | System Admin, School Registrar, and Incoming Students or Enrollees. |
| Tools Used: | Diagram tools that provide activity diagram symbols. |
| Designer: | Sourcecodehero.com |
What is a Student Enrollment System?
An online student enrollment system consolidates all data in one location, making it easy to access and modify. Enrollment information is automatically uploaded to the database, so there is no need to enter it in manually.
The system is also intended to manage all of the activities associated with the student enrollment process. Its primary objective is to assist staff members in enrolling students and keeping track of their information.
Overall, the system is capable of managing registration, cash flow, student information, instructor recognition, classroom resources, data searching, data analysis, and decision making. This will save the administrator time and effort.
Define Student Enrollment System Activity Diagram
A student enrollment system activity diagram is defined by UML as a very effective behavior diagram. This diagram depicts the interaction between the system and the clients. This is accomplished by assisting them in visualizing the system’s functionality in varying degrees of detail.
The activity diagram in UML visually depicts a set of actions or control flows of a student enrollment system. It describes the processes in a use case diagram. Its’ illustration can also be sequential or concurrent.
Furthermore, the activity diagram can be used to clarify challenging use cases (use case diagram) in order to simplify and improve any process. It represents the actions, functions, and processes of the system.
Importance of UML Activity Diagram
The use of an activity diagram entails major actions that determine the project’s workflow. These activities are triggered by user decisions, resulting in more effective interaction. It also shows a collection of actions or control flows from a student enrolling system.
In UML, an activity diagram shows the main tasks and limits of the Student Enrollment System. Then, these activities make a flow that should be part of the project. Each activity was correctly labeled so that the system’s behavior could be figured out.
The activity diagram is a UML diagram that is part of the Student Enrollment System. It also shows how the system changes over time. It shows how messages move from one task to the next.
Activity Diagram: Benefits
The Activity Diagram Benefits are as follows:
- Using an Activity Diagram, you can see how an algorithm works.
- It also talks about the steps a UML use case goes through.
- In a process or workflow, it shows how users and the system work together.
- Clarify hard use cases to make a process easier to follow and better.
Student Enrollment System Activity Diagram
The Student Enrollment System Activity Diagram example goes into more detail about the ideas behind the system. This example of an activity diagram with swimlanes is shown in detail to help programmers understand.
It figures out what a user does when they log in to a system. This example shows some of the things that happen when you book something online. So, the focus here was on the actions and choices that were made.
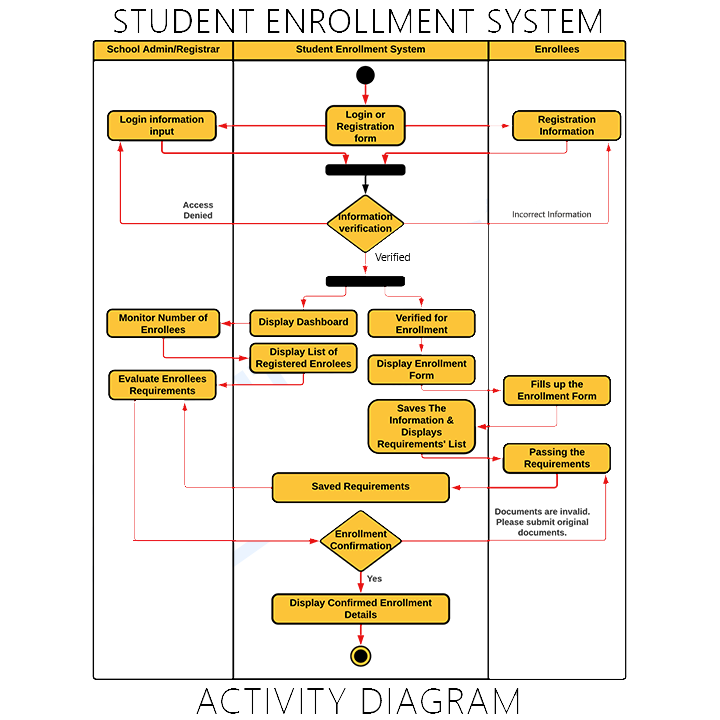
We used the swimlane with three partitions, as shown in the figure. The admin lane is shown on the left. It encompasses all of the activities that an administrator may engage in while utilizing the system. Its container also represents the extent of the admin’s power.
The enrollee’s lane is on the right partition. This lane represents the actions and processes of the enrollee.
The scope and operations of the system were now centered. This demonstrates how the system functions as a go-between for school officials and students. As a result, the system is designed to be accessible to both administrators and enrollees.
Users must have their accounts logged into the program in order to access the system. As the operations flowed and the system and users communicated, the functions were emphasized.
You can add more to this, and how you design your activity diagram is entirely up to you. However, be certain that you have accurate information and that the crucial decisions are included (actions).
What are the Symbols used in Activity Diagram?
Activity Diagram Symbols – are used not only to design an activity diagram, but also to highlight the role of everyone involved in the system’s process. Each of the symbols represented a different aspect of the system.

- Start – is the beginning of the action. It uses a filled circle symbol to show its function.
- Action – is a stage of an activity in which users or software accomplish a certain task. Action is shown in Round-edged rectangles.
- Decision – symbolizes a conditional branch in the flow. It has two or more outputs and a single input. A diamond symbol presents this notation.
- Swim Lanes – are the lanes showing the actor’s boundaries. The activities drew in the same lane considered as the organization’s activities. Swim lanes must be in a logical arrangement.
- Activity Flow – is another name for the connectors in the diagram that illustrate the flow between processes (activity).
- End (Terminator) – is the last phase of the activity. An indicated black circle represents the final node.
Each of these activity diagram symbols shows the overall system behavior. Emphasizing the system’s behavior would also be much easier by using these Activity Diagram symbols.
How to Draw an Activity Diagram?
Time needed: 5 minutes
Here are the steps in developing (designing) the activity diagram for student enrollment system.
- Step 1: Familiarize Activity Diagram Symbols
To create an activity diagram, you must first become acquainted with the symbols that will be utilized.
The symbols allow you to discuss the system’s activity flow and interaction. Programmers can also rapidly convey the concept of the system to users. - Step 2: Identify the flow of actions.
After getting used to the symbols, you will need to figure out how the actions go from one to the next. Your use case diagram would show how things would happen.
Actions show the order or series of things that happen when a user starts the student enrollment. In an activity diagram, the action is also a discrete unit of functionality. It also talks about what each step in a UML use case diagram looks like.
The control flow of data is shown by the incoming and outgoing activity edges of an action. When all of the input requirements are met, it starts to do what it needs to do. - Step 3: Add the Actors (users) involved.
Actors do things to them, changing them into other things or changing how they are. This actor is something or someone outside of the system that interacts with the system.
We put labels on the swimlanes that say “actors” to show that the action or step was done by them or by the system. This will help readers and developers figure out how the system will work or how it will interact with actors or the other way around. - Step 4: Trace the flow of activities.
To figure out how things work, you need to know that flows can be run, branch, or sequential.
Action or control flows help developers figure out how to move from one state of activity to another. In this notation, there could be more than one action flow coming in or going out.
Also, the flow of an activity is set by the control flow, and the inbound arrow starts a single activity step. After this step is done, the flow keeps going in the direction of the outgoing arrow. Object flow also talks about how objects (data) move through an activity.
Conclusion:
Finally, we reviewed What is an Activity Diagram for a Student Enrollment System and how to create one. One of the approaches for developing a student enrolling system is represented by this activity diagram.
An activity diagram also emphasizes the system’s flow of activities and the interactions between users and the system.
As a result, adopting an activity diagram in UML will not only help you comprehend the project but will also inform you of the possibilities as you create it. This diagram works best when used with the other UML Diagrams supplied in the Recommended Articles. Other Activity Diagrams can be found in the Related Articles section below.