What is a Chart in Javascript?
Chart in JS is a free JavaScript library that lets you make charts using HTML.
It is one of the easiest JavaScript libraries for visualizing data, and it comes with the following chart types.
Actual Output:
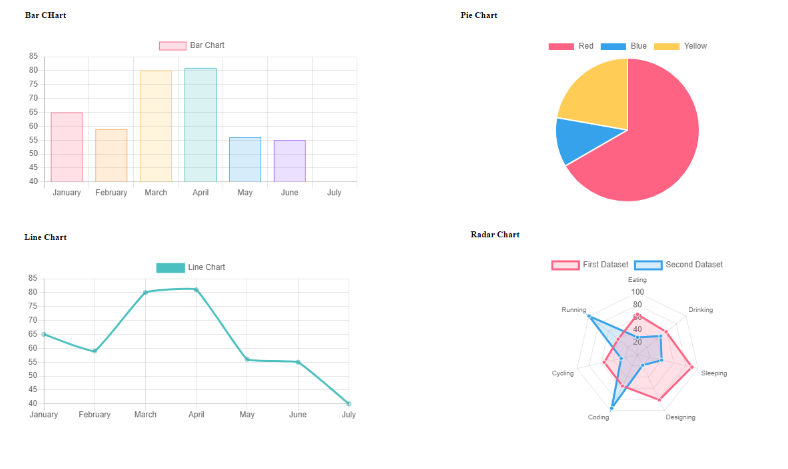
These are the examples of Chart with javascript
- Bar Chart – The horizontal, rectangular bars in a bar chart are used to compare the values of different categories or data series.
- Line Chart – A line chart shows how the price of an asset has changed over time by connecting a series of data points with a single line.
- Pie Chart – A circle chart with segments cut out by radii to show relative sizes or frequencies. Also called a circle graph.
- Radar Chart – A radar chart is a graphical way to show data from three or more quantitative variables in the form of a two-dimensional chart.
What is the best chart for JavaScript?
Bar charts are good for comparing things, while line charts are better for showing changes over time. Spreadsheets with scatter plots are good for showing relationships and distributions.
Pie charts, on the other hand, should only be used for simple compositions and not for showing relationships or distributions.
Why Bar Chart in Javascript is important?
Bar charts are good for comparing things, while line charts are better for showing changes over time. Spreadsheets with scatter plots are good for showing relationships and distributions.
Pie charts, on the other hand, should only be used for simple compositions and not for showing relationships or distributions.
About the Project
This Chart In Javascript is built in javascript code alone using the editor sublime text. The project is fully functional when it comes to displaying charts or graphs.
The following javascript project covers all of the required and vital elements that can be used for college projects by first-year, second-year, and final-year IT students.
Project Details and Technology
| Project Name: | Chart In Javascript with Source Code and Examples |
| Abstract | Chart In Javascript is one of the programs that makes it easy to make charts and graphs. |
| Language/s Used: | JavaScript |
| JavaScript version (Recommended): | ES2015 |
| Database: | N/A |
| Type: | Web Application |
| Developer: | TEDTED ENORIA |
| Updates: | 0 |
To begin constructing the system project, make sure you have any platform for creating JavaScript, bootstrap, and HTML installed on your computer; in my instance, I’ll be using Sublime Text.
Steps how to run the project
Time needed: 3 minutes
- Step 1: Download Source Code
To get started, find the downloaded source code file below and click to start downloading it.

- Step 2: Extract File
Navigate to the file’s location when you’ve finished downloading it and right-click it to extract it.

- Step 3: Run the project
click the index.html inside the folder to start executing the project.


Download the Source Code below
Summary
For those Web developers interested in learning more about web apps, this system is a fully functional project.
Related Articles
- Line Chart in PHP with Source Code
- Pie Chart in PHP MySQL with Source Code
- Bar Graph in PHP with Source Code
Inquiries
If you have any questions or comments on the project, please leave a comment below.