Hi! Today, I’ll share some thoughts on the Entity Relationship Diagram (ERD) of the Student Management System.
This small database will also provide you with a thorough overview of the tables in the Student Management System database project.
This course will teach you how to administer a student reservation database and how to construct a database for a student management system.
You will get the Student Management System ER diagram PDF and PPT files at the end of the talk, which will be useful for your DBMS studies.
What are included in this ER Diagram of Student Management System Database projects?
- Student Management System Description with Features
- Student management system database tables
- Schema diagram for Student management system
- ER Diagram for Student Management System
Student Management System ER Diagram and Database Structure Description
The database design for the Student Management System stores all of the data that enters and exits the system. It uses the ER Diagram concept to arrange the data.
What data should be saved and how should the various data elements interact is decided by the developer or proponent. Using the entity relationship diagram model, developers will map the data to the database design.
Additionally, it generates prototypes of the proposed database system’s logical and physical designs. Independent of physical factors, the logical model focuses on data requirements and data to be stored.
How to build an ER Diagram of the Student Management System?
Time needed: 5 minutes
Here are the Student management system features which were the basis in creating the database tables and ER Diagram design for project development.
- Familiarize the ER Diagram (Entity Relationship Diagram)
Entity Relationship Diagram (ERD) – a diagram that depicts the organization of data types in a project. It makes use of symbols to make its parts and relationships clear.
Before you design the ER Diagram, you must be familiar with their symbols and applications. Entity Relationship Diagram (ERD) Is a diagram that depicts the organization of data types in a project. It makes use of symbols to make its parts and relationships clear.
Before you design the ER Diagram, you must be familiar with their symbols and applications.
Symbols in the ER Diagram:
• Fields: The parts of a table that specify the entity’s characteristics are called fields. Attributes are generally thought of as rows in the database that the ERD models.
• Keys: This is a method of categorizing data properties. It’s used to arrange ER diagrams and help users model their databases so they’re more efficient. This is also how distinct tables in a database are linked together.
Primary Key: A unique attribute or collection of attributes that identifies a particular entity instance.
When data attributes have a one-to-many relationship with other entities, a foreign key is created.
Cardinalities in the ER Diagram: Cardinality and ordinality are demonstrated by the way a line is styled and terminated.
Cardinality refers to the amount of times an instance of one thing can be linked to instances of another entity.
Ordinality, on the other hand, relates to how many times a single entity instance can be linked to another. - Determine the targeted users
After you’ve familiarized yourself with the symbols, you’ll need to figure out who your target audience is.
Your project’s target users will be the ones who use it.
Your users will be the admin, students, and staff if your project is a Student Management System. You could inquire about the common activities that users engage in while working in the library.
These details will aid you in the next phase. After you’ve familiarized yourself with the symbols, you’ll need to figure out who your target users are.
Your project’s target users will be the ones who use it.
Your users will be the admin, students, and staff if your project is a Student Management System. You could inquire about the common activities that users engage in while working in the library. This information will assist you in taking the next step. - Analyze the entities and their included attributes
After you’ve familiarized yourself with the symbols, you’ll need to figure out who your target audience is. Your project’s target users will be the ones who use it.
Your users will be the admin, students, and staff if your project is a Student Management System. You could inquire about the common activities that users engage in while working in the library. These details will aid you in the next phase.
After you’ve familiarized yourself with the symbols, you’ll need to figure out who your target users are. Your project’s target users will be the ones who use it.
Your users will be the admin, students, and staff if your project is a Student Management System. You could inquire about the common activities that users engage in while working in the library. This information will assist you in taking the next step - Plot the Entity Relationship Diagram
You’ll need the entities, their properties, and their relationships to plot the ERD.
To create an exact Entity Relationship Diagram, you will base the data structure on the evaluated information.
– To create the ER Diagram, start by listing all of the entities associated with the Student Management System. The properties that are included will then be placed beneath them. This will assist you in the creation of the ER Diagram Fields.
– Don’t forget about the attribute keys. The keys will determine whether or not there are any potential relationships between entities.
– Finally, you’ve completed your ER Diagram.
Student Management System Database Tables
The tables below provide the complete database table details such as Field Name, Descriptions, data types, character lengths.
Table Name: tbl_Student
| Field Name | Description | Type | Length |
| stud_ID (PK) | Student ID Number | Int | 11 |
| stfname | Student First Name | Varchar | 30 |
| stlname | Student Last Name | Varchar | 30 |
| stcourse | Student Course | Varchar | 30 |
| styear | Student Year | Int | 11 |
| stcontact | Student Contact Number | Int | 11 |
| stage | Student Age | Int | 11 |
| stbirthdate | Student Birth Date | Date | |
| stgender | Student Gender | Int | 11 |
Table Name: tbl_Course
| Field Name | Description | Type | Length |
| course_ID (PK) | Course ID Number | Int | 11 |
| course_desc | Course Description | Text | |
| units | Course Units | Int | 11 |
| course_remarks | Course Remarks | Text |
Table Name: tbl_Staff
| Field Name | Description | Type | Length |
| staff_Id (PK) | Staff ID Number | Int | 11 |
| fname | Staff First Name | Varchar | 30 |
| lname | Staff Last Name | Varchar | 30 |
| contact | Staff Contact Number | Int | 11 |
| address | Staff Address | Varchar | 255 |
| gender | Staff Gender | Varchar | 30 |
Table Name: tbl_Staff_Department
| Field Name | Description | Type | Length |
| staff_ID (PK) | Staff ID Number | Int | 11 |
| course_line (FK) | Staff Course Line | Int | 11 |
Table Name: tbl_Project_Transaction
| Field Name | Description | Type | Length |
| transaction_ID (PK) | Transaction ID Number | Int | 11 |
| transaction_name | Transaction Name | Varchar | 30 |
| stud_ID (FK) | Student ID Number | Int | 11 |
| staff_ID (FK) | Staff ID Number | Int | 11 |
| transaction_date | Transaction Date | Date |
Table Name: tbl_Student_Registration
| Field Name | Description | Type | Length |
| registration_ID | Registration ID Number | Int | 11 |
| name | Registration Name | Varchar | 30 |
| content | Registration Content | Varchar | 30 |
| registration_date | Registration Date | Date |
Table Name: tbl_Student_Reports
| Field Name | Description | Type | Length |
| report_ID (PK) | Report ID Number | Int | 11 |
| reports_name | Report Name | Varchar | 30 |
| student_records (FK) | Student Record | Int | 11 |
| transaction_reports (FK) | Transaction Record | Int | 11 |
Entity Relationship Diagram for Student Management System
Entity Relationship Diagram Symbols
ER Diagram of Student Management System with Relationship
ER Diagram of Student Management System shows the system entity relationships in each entity and their supposed functions in each relationship.
This section will show you the ER Diagram for the Student Management System.
In the image below you see the actual relationship of all entities. In creating this activity diagram we used lucidchart.
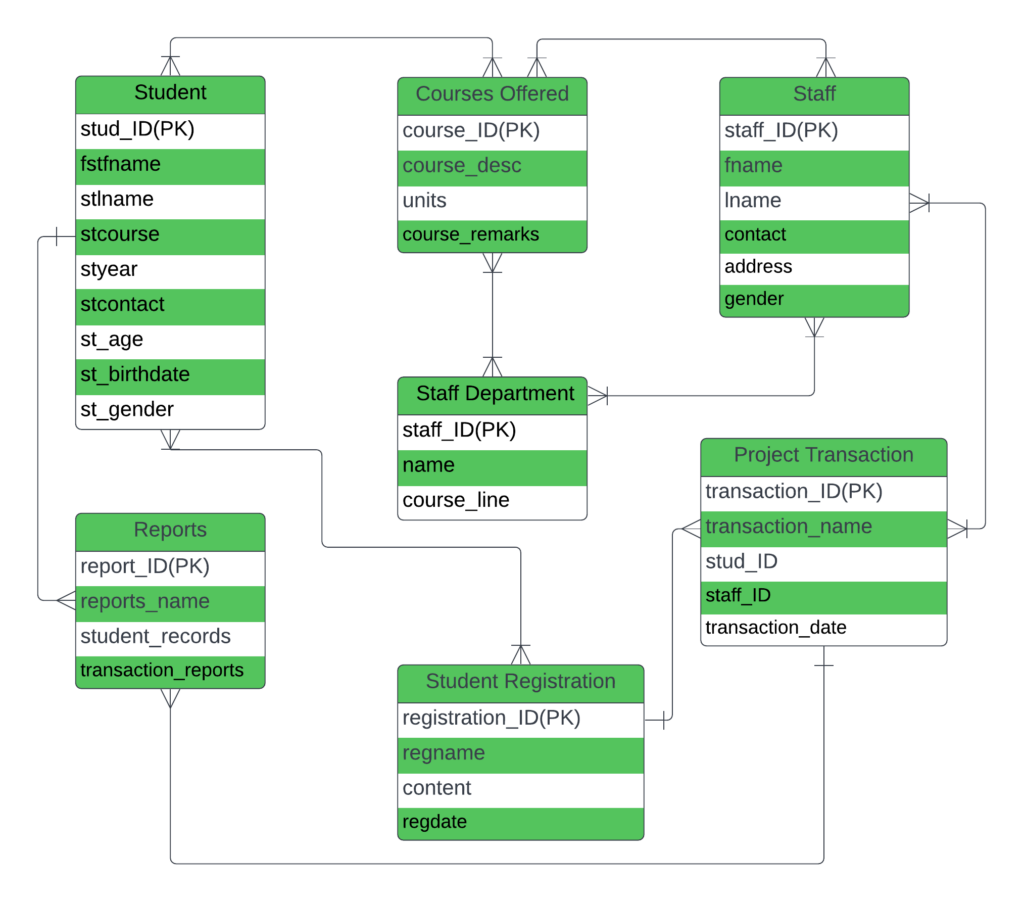
ER Diagram of Student Management System
The database design shown with tables in the Entity Relationship diagram of the Student Management System is shown in the image above.
The tables are designed to suit the system’s requirements and to provide considerably more detailed information about each entity within the system.
The purpose of this ER Diagram is to thoroughly comprehend both the Student Management System and the table relationships in the project database design.
You can also get a PDF copy of the conversation if you want to use it as a reference for your project.
Conclusion:
To summarize, we have discussed the ER diagram for the Student Management System, and above we have the system database tables and their relationships.
Inquiries
If you have inquiries or suggestions about ER Diagram of Student Management System With Database Structure just leave us your comments below.
We would be glad to know to concerns and suggestions and be part of your learning.
Keep us updated and Good day!