
Shopping Cart Data Flow Diagram (DFD)
The Shopping Cart DFD (Data Flow Diagram) explains the “flow” of information on the project. It is used to record the transformation of data (input-output) for the development of a project.
The shopping cart’s data flow diagram (DFD) consists of DFD levels 0, 1, and 2. Additionally, it utilizes entities, processes, and data that define the whole system.
Shopping Cart Data Flow Diagram: Details
The table shows the project name and details of the Shopping Cart Data Flow Diagram. It has complete information about the project.
| Name: | Shopping Cart Data Flow Diagram |
| Abstract: | The Shopping Cart Data Flow Diagram (DFD) shows the structure of the project in terms of its data management. It contains the important details on the flow of data and alternatives done in the project. |
| Diagram: | Data Flow Diagram also known as DFD |
| Users: | Seller, Buyer (Customers), and Admin |
| Tools Used: | You may use any Diagram tools that provide data flow diagram symbols. |
| Designer: | Sourcodehero.com |
Definition of Shopping Cart
Shopping cart software is part or equal to e-commerce software online. This software runs on a web server and allows visitors to choose things for purchase. Additionally, customers who shop online can create a wish list of products to buy using this software.
The purpose of the program is to help internet businesses, especially with massive customer data. It is done by giving them at least a simple self-service alternative. In addition, retailers may save time and money and keep the consumers pleased by outsourcing the duty to the shopping cart.
What is Shopping Cart DFD?
DFD is one of the strategies used for shopping cart creation (data flow diagram). It shows the primary processes and options that create the system’s internal data flow. Moreover, the data were appropriately classified to highlight the Shopping Cart’s structure.
Importance of Data Flow Diagram (DFD)
The importance of Data Flow Diagram (DFD) for the Shopping Cart is important because it shows the developers what is really going on in the system. This is done by seeing how the system manages data at different levels.
In addition, the related DFD levels for shopping carts were used to develop the data flow inside the project. These levels contribute to the elaboration of the system’s data flow structure. This structure will also be the guide for developers in creating the Shopping Cart ER Diagram.
Data flow diagrams not only describe the flow of data but also denote the steps involved in transferring data from one process to another. As a result, the data was transformed from input to output.
Advantages of Data Flow Diagram:
The Advantages of the Shopping Cart Data Flow Diagram are as follows:
- It facilitates the display of system contents.
- Included in the documentation file for the system.
- Simple to comprehend and understand by both programmers and users.
- DFDs are complete and well-explained representations of system components.
- It also assists in knowing the functioning and limits of a system.
Shopping Cart Data Flow Diagram Example
A detailed description of the sample data flow diagram for the shopping cart is given. This instance highlights the three DFD levels (DFD Levels 0, 1, and 2).
Level 0 DFD Diagram for Shopping Cart
The context diagram is an alternate name for the Shopping Cart Level 0 DFD Diagram. Composed of users, the primary process, and data flow. Additionally, the idea of the project is presented via a single process visualization.
Level 0 of the DFD identifies the entities that interact with a system and the boundary between the system and its environment. This graphic also provides an overview of the Shopping Cart Project.

The illustration presents the main process in a single node to introduce the project context. This context explains how the project works in just one look. The user feeds data into the system and then receives the output from it.
Moreover, you will see via the graphic that data flow is already present. Although the procedure is quite generic, the data flow is transparent. However, just adapt this graphic to match the other criteria and include other shopping cart-related details.
DFD Level 1 Diagram for Shopping Cart
The context diagram’s “detonated view” is Shopping Cart DFD Level 1. Its purpose is to expand upon the notion deduced from the context diagram.
In particular, level 1 shows the bigger details of Shopping Cart DFD Level 0. This is to make it clear how data moves from input to output and how it changes along the way.
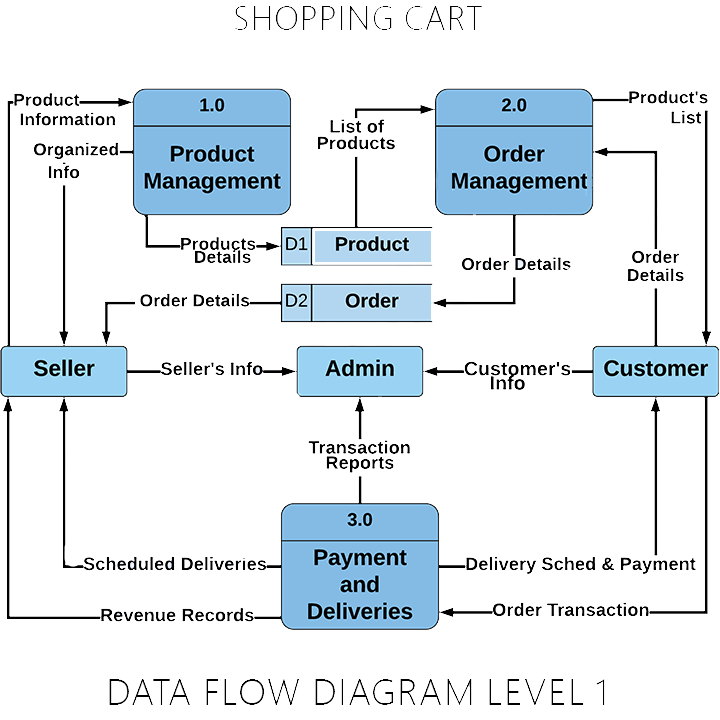
The diagram shows three different situations: the management of products, the management of orders, and the management of payments and deliveries. First, the seller and the customer start the flow of data. The system then handles the transaction. This idea came from the way people shop or do business.
You can also look at the data store or database that is being used. The information that the user puts in is also saved in a database. Then it is used to make outputs.
Level 2 DFD for Shopping Cart
Level 2 DFD for Shopping Cart is moreover the most abstract data flow diagram. This level further expands the concept introduced in DFD level 1. It consists of the sub-processes from level 1 as well as the flow of data.

However, subprocesses are not required for all project processes. Provide this diagram only if necessary. This level is not necessary if your previous diagrams were clear and exact.
You may add to this, and how you design your data flow diagram is up to you. Additionally, evaluate the data flow and provide accurate information.
Shopping Cart (DFD) Data Flow Diagram Pdf
You may download the Data Flow Diagram for Shopping Cart PDF by clicking the button below. It contains the complete information and analysis of the Data Flow Diagram for shopping. You may also edit its content to meet the requirements and specifications of your project.
Data Flow Diagram Notations:
- External Entity: provides or receives information and communicates with the system. They are where data comes from and goes when it enters or leaves the system. A third-party company or person, a computer system, or a business system could also be an entity. People use the words terminators, sources, sinks, and actors to talk about entities.
- Process: is the part of DFD that changes data and makes something new. It also does calculations, sorts data based on logic, or controls the flow of data based on business standards.
- Data Store: A database table or a membership form are examples of files or other places where information can be stored for later use.
- Data Flow: is the route that data takes between outside entities, processes, and data stores. It shows how the other parts connect to each other. It is indicated by arrows and labeled next to them.
These notations on the data flow diagram reflect the entire data handling. Using these Data Flow Diagram symbols would also aid in drawing simpler attention to the architecture of the system.
How to build Data Flow Diagram for Shopping Cart
Time needed: 5 minutes
Steps in building a Data Flow Diagram for Shopping Cart.
- Step 1: Familiarize Data Flow Diagram (DFD) Notations
Data flow diagrams show how information moves through a system or process. It also includes data inputs and outputs, as well as data stores and users. Before you make the actual diagram, you need to know what its symbols mean and how to use them.
- Step 2: Analyze the processes and data included
When making a data flow diagram, analysis is a very important step. It also helps you figure out what the diagram means and avoid making mistakes.
When making the diagram, the information from the users is very helpful. You must also look at the data and decide on the general processes.
From the general processes, you’ll be able to see what kinds of data could go into and out of the system. But only user information and processes that have to do with logging in are included. Then you are ready to move on. - Step 4: Plot the Data Flow Diagram
We will need the users, processes, databases, and data flows to make the data flow diagram. Then, we’ll use the evaluated information to figure out how the data should flow to get the exact data flow diagram.
First, we need to know who will be using the system and what their main tasks will be. First, this will make the DFD Level 0 diagram, also called the context diagram.
Then In DFD Level 0, we’ll get more into the idea. To do this, we will need to figure out the smaller steps that are needed to finish the main step. We will also add a data store where the data that has been processed will be kept.
After that, we’ll follow the flow or path of data to find out how data inputs are changed into data outputs. This will make Level 1 of the DFD.
Lastly, Adding the supporting processes in DFD Level 1 brings DFD to a close. We’ll connect them to the existing level to make the data flow diagram more detailed.
Conclusion:
In conclusion, we have reviewed the information required to construct a data flow diagram. Its primary objective is to focus on data transformation from input to output. In addition, DFD levels were extremely helpful in developing the system.
In addition, the information was suitably classified to emphasize the Shopping Cart’s organizational structure. This documentation will assist not only with the project’s basis but also with its behavior.
Take note that DFD is not part of the Shopping Cart UML Diagrams, but they complement each other in explaining the project activities, behaviors, interactions, and structure. Check out these recommended and related articles for more!
Inquiries
If you have any questions or comments on Shopping Cart Data Flow Diagram (DFD), please post them in the section below. We would appreciate hearing your issues and recommendations and participating in your education.
Keep us updated and Good day!