
The Employee Attendance Management System DFD explains the “flow” of information on the project. It is used to record the transformation of data (input-output) for the development of a project.
The employee attendance system DFD consists of DFD levels 0, 1, and 2. Additionally, it utilizes entities, processes, and data that define the whole system.
Employee Attendance Management System DFD: Details
The table provides an overview and features of the data flow diagram (DFD) for employee attendance management system. It contains detailed descriptions of the project.
| Name: | Employee Attendance Management System (DFD) Data Flow Diagram |
| Abstract: | The employee attendance system data flow diagram (DFD) shows the structure of the project in terms of its data management. It contains the important details on the flow of data and alternatives done in the project. |
| Diagram: | Data Flow Diagram (DFD) |
| Users: | School Admin, Students, Staff, and Visitors. |
| Tools Used: | You may use any Diagram tools that provide data flow diagram symbols. |
| Designer: | Sourcecodehero.com |
What is an Employee Attendance Management System?
The employee Attendance Management System is a tool that many businesses use to keep track of their employees’ time in the office. It makes it easier for employers to keep track of their employees’ labor costs and time off.
Furthermore, the system helps business owners increase their productivity and cut down on time-consuming, expensive, and difficult tasks like managing employees. It can also figure out and print out reports about the labor costs of employees.
What is Employee Attendance Management System DFD?
The DFD is one of the ways that employee attendance management systems are made (data flow diagram). It shows the system’s main processes and options that make the data flow inside the system.
Further, the data was put into the right categories to show the structure of the employee attendance management system. Note that DFD is not part of the Employee Attendance System UML Diagrams. However, they both help explain the activities, behaviors, interactions, and structure of the project.
Importance of Data Flow Diagram (DFD)
The data flow diagram (DFD) for the employee attendance system is important because it shows the developers what is really going on in the system. This is done by seeing how the system manages data at different levels.
Furthermore, the DFD levels were used to talk about the flow of data in the employee attendance system. These levels do their part to explain how the data flows through the system. It is then applied in creating Employee Attendance Management System ER Diagram.
Data flow diagrams not only show how data moves from one process to another, but they also show the steps that are taken to move data from one process to another. So, the data went from being input to being output.
Advantages of Data Flow Diagram:
The Advantages of the Employee Attendance Management System Data Flow Diagram are as follows:
- It facilitates the display of system contents.
- Included in the documentation file for the system.
- Simple to comprehend and understand by both programmers and users.
- DFDs are complete and well-explained representations of system components.
- It also assists in knowing the functioning and limits of a system.
Employee Attendance Management System DFD Diagram
The presented sample data flow diagram for the Employee Attendance Management System is with a detailed explanation. This instance highlights the three DFD levels (DFD Levels 0, 1, and 2).
Employee Attendance Management System DFD Level 0
The Employee Attendance Management System DFD Level 0 can also be called the context diagram. Its parts are the users, the main process, and the flow of data. The concept of the project is also shown by the single process visualization.
Level 0 of the DFD shows the parts of a system that interact with it and defines the boundary between the system and its environment. This diagram also shows at a high level how the system for tracking employee attendance works.
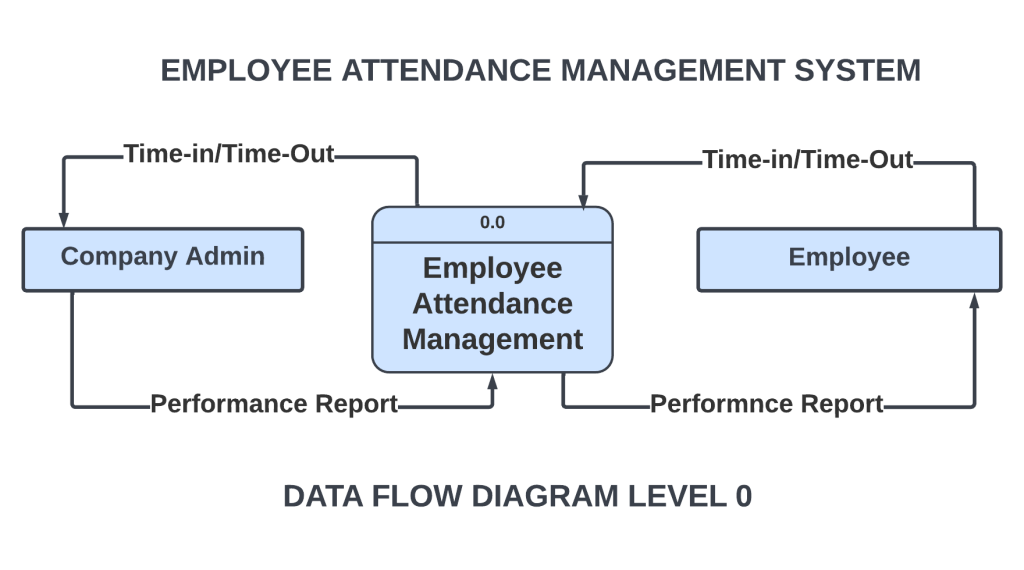
The illustration presents the main process in a single node to introduce the project context. This context explains how the project works in just one look. The user feeds data into the system and then receives the output from it.
In addition, the figure demonstrates that data flow is currently occurring. Even though the procedure is fairly extensive, the data flow across it is obvious. Nonetheless, just modify this design to meet the other specifications and include more information about handling logins.
Employee Attendance Management System DFD Level 1
The “detonated view” of the context diagram is Employee Attendance Management System DFD Level 1. Its purpose is to expand upon the notion deduced from the context diagram.
In particular, level 1 shows the bigger details of DFD Level 0 Employee Attendance Management System. This is to make it clear how data moves from input to output and how it changes along the way.
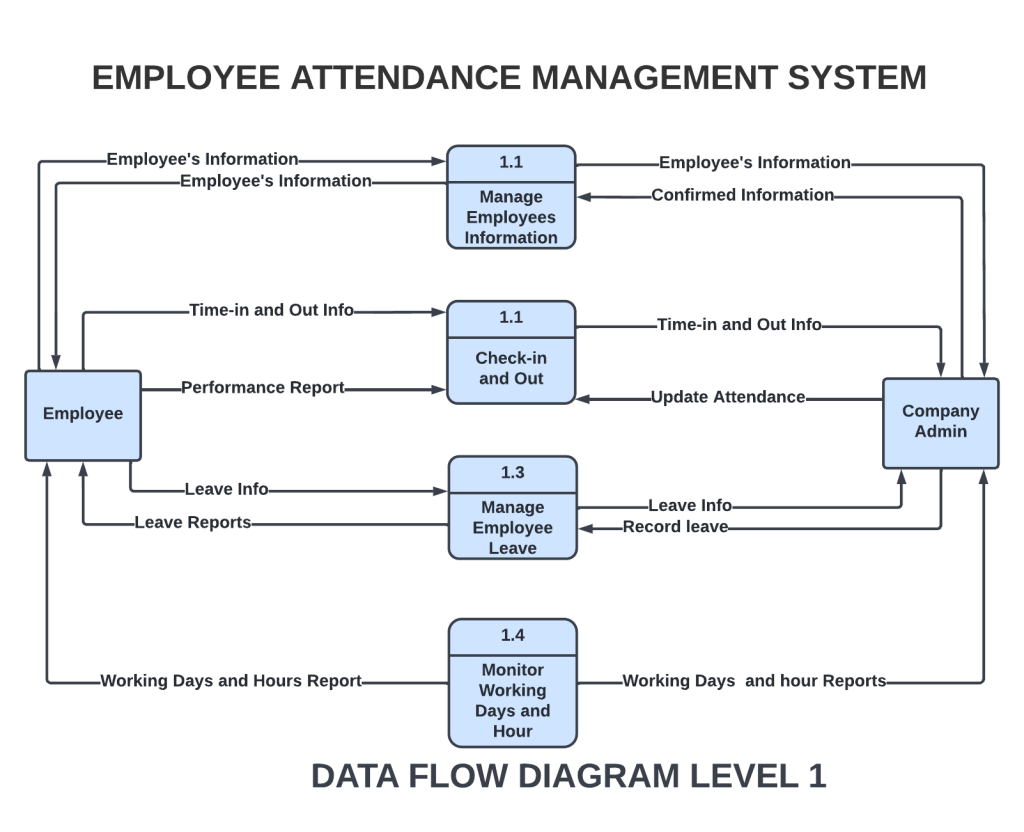
The diagram shows four different situations: managing customer information, managing orders or reservations, planning delivery times, and managing transactions and payments.
Firstly, the flow of data starts from the restaurant admin or owners and customers. Then the system caters to the transaction. This idea was based on employee attendance management processes or transactions.
You can also look at the data store or database that is being used. The database is also used to store the information that users put in. Then it is used to make outputs.
Employee Attendance Management System DFD Level 2
Employee Attendance Management System DFD Level 2 is also the most abstract data flow diagram level. This level further expands the concept introduced in DFD level 1. It consists of the sub-processes from level 1 as well as the flow of data.
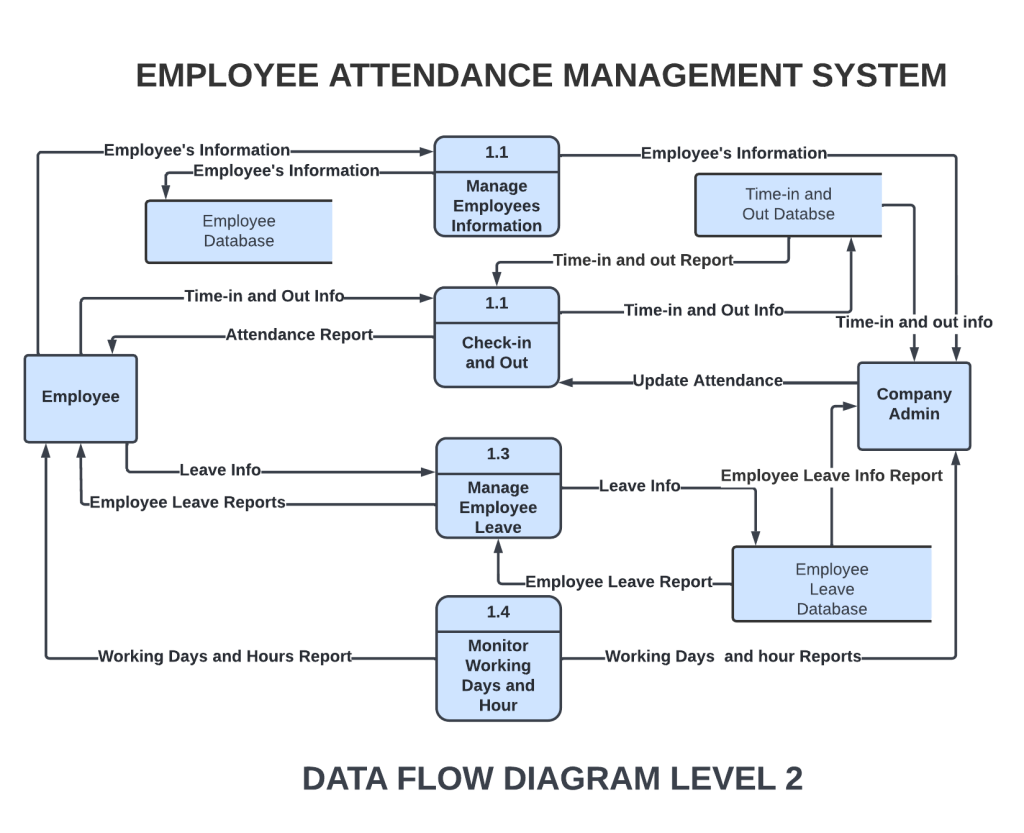
However, subprocesses are not required for all project processes. Provide this diagram only if necessary. This level is not necessary if your previous diagrams were clear and exact.
You can add to this, and how you make your data flow diagram is up to you. Also, think about how the data flows and make sure your information is correct.
Employee Attendance Management System DFD Pdf
Click the button below to get the DFD for Employee Attendance Management System in PDF format. It contains a comprehensive analysis of the System’s Data Flow Diagram. You may also adjust its content to meet the demands of your project.
Data Flow Diagram Notations:
We used DFD notations to explain how the data flow diagram works. They were shown in symbols that were easy to understand. These things are shown by the signs:
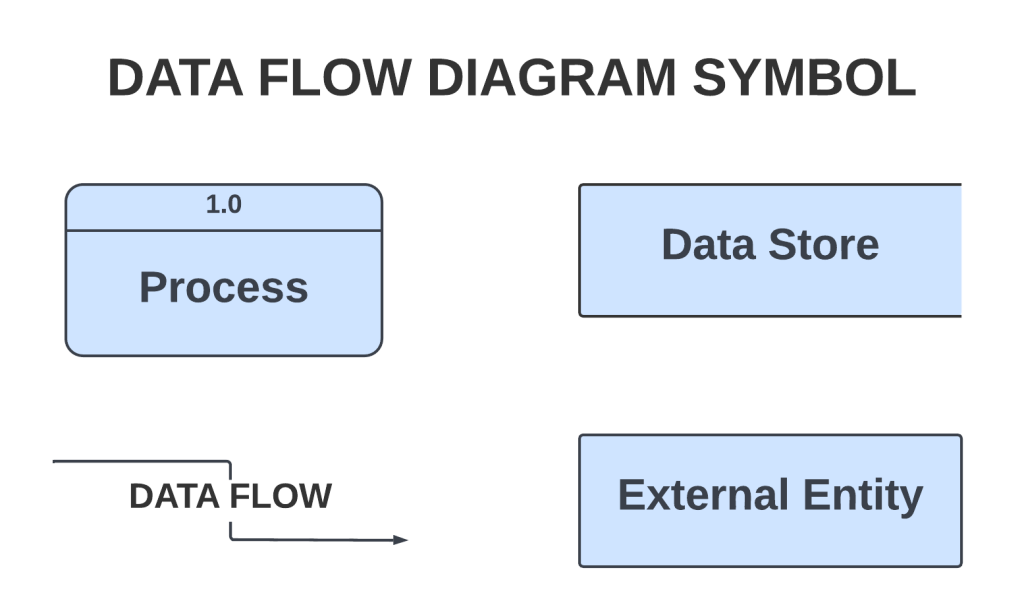
- External Entity: provides or receives information and communicates with the system. They are where data comes from and goes when it enters or leaves the system. A third-party company or person, a computer system, or a business system could also be an entity. People use the words terminators, sources, sinks, and actors to talk about entities.
- Process: is the part of DFD that changes data and makes something new. It also does calculations, sorts data based on logic, or controls the flow of data based on business standards.
- Data Store: A database table or a membership form are examples of files or other places where information can be stored for later use.
- Data Flow: is the route that data takes between outside entities, processes, and data stores. It shows how the other parts connect to each other. It is indicated by arrows and labeled next to them.
These signs on the data flow diagram indicate how each and every piece of data is handled. Using these Data Flow Diagram symbols would also help describe the system’s architecture.
How to Create Data Flow Diagram?
Time needed: 5 minutes
Here’s the simplest way to create your DFD diagram for Employee Attendance Management System.
- Step 1: Familiarize Data Flow Diagram (DFD) Symbols
Data flow diagrams show how information moves through a system or process. It also includes data inputs and outputs, as well as data stores and users. Before you make the actual diagram, you need to know what its symbols mean and how to use them.
- Step 2: Analyze the processes and data included
When making a data flow diagram, analysis is a very important step. It also helps you figure out what the diagram means and avoid making mistakes.
When making the diagram, the information from the users is very helpful. You must also look at the data and decide on the general processes.
From the general processes, you’ll be able to see what kinds of data could go into and out of the system. But only user information and processes that have to do with logging in are included. Then you are ready to move on. - Step 3: Plot the Data Flow Diagram
We will need the users, processes, databases, and data flows to make the data flow diagram. Then, we’ll use the evaluated information to figure out how the data should flow to get the exact data flow diagram.
First, we need to know who will be using the system and what their main tasks will be. First, this will make the DFD Level 0 diagram, also called the context diagram.
Then In DFD Level 0, we’ll get more into the idea. To do this, we will need to figure out the smaller steps that are needed to finish the main step. We will also add a data store where the data that has been processed will be kept.
After that, we’ll follow the flow or path of data to find out how data inputs are changed into data outputs. This will make Level 1 of the DFD.
Lastly, Adding the supporting processes in DFD Level 1 brings DFD to a close. We’ll connect them to the existing level to make the data flow diagram more detailed.
Conclusion
In conclusion, we have reviewed the knowledge required to design a data flow diagram. Its primary objective is to focus on data transformation from input to output. In addition, DFD levels were extremely helpful in developing the system.
Additionally, the information is labeled suitably. It displays the organizational structure of the system for managing employee attendance. This documentation will assist not only with the project’s basis but also with its behavior. Check out these linked and suggested articles for additional information!