
A Line Chart in PHP is a type of graph that shows how data changes over time. Line charts are made by plotting a set of points and drawing a straight line between them.
Line charts are used to see how things change over both short and long periods of time.
Please scroll down to the bottom of this post to download the free Line Chart in PHP with Source Code. look for “Click Here To Download The Source Code” button to start your project.
Project Output:

Importance Of Line Graph In PHP MySQL Source Code?
line graph in php are important for keeping track of changes over short and long period of time.
It’s also used to compare how different groups changed over the same amount of time.
What is The Use Of Charts in PHP?
Chart php mysql can be used to show what part of the whole something is and what that part is at a certain point in time. Charts don’t show changes over time like bar graphs and line graphs do.
Advantage Of Line Graph Using PHP?
line graph using php are a quick way to see how data fits together. You can quickly see the range, the minimum and maximum, and if there are any gaps or groups.
This also means that it is easy for it to see how things change over time. You can use exact values from your data to draw them.
About The Project
A fully operational project built on the Line Chart in PHP with Source Code that makes use of the PHP programming language and the MySQL database.
Moreover, The PHP project below has all the necessary components that second-year IT students can use for their academic assignments.
It contains a variety of tools that let users regulate the student results according to grading standards.
Project Details and Technology
| Project Name: | Line Chart in PHP with Source Code |
| Abstract | Line Chart in PHP are used to see how things change over short and long periods of time. Line graphs are better than bar graphs when the changes are small. Line graphs can also be used to compare how different groups changed over the same amount of time. |
| Language/s Used: | PHP, JAVASCRIPT |
| PHP version (Recommended): | PHP Version 5.6, 7.4 |
| Database: | MySQL |
| Type: | Web Application |
| Developer: | Tedted Enoria |
To start executing this project, make sure that you have any platform of code editor installed in your computer, In my case I will use Sublime Text.
Steps On How To Run The Line Chart in PHP
Time needed: 5 minutes
These are the steps to run a Line Chart in PHP With Source Code.
- Step 1: Download Source Code
To begin, locate the downloaded source code file below and click to begin downloading it.

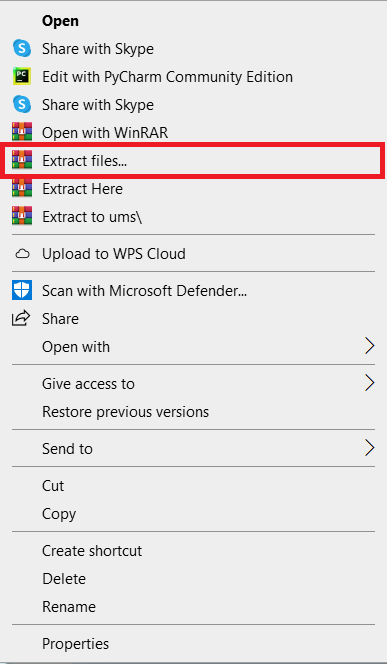
- Step 2: Extract File
After you’ve completed downloading the file, navigate to its location and right-click it to extract it.

- Step 3: Copy Project Folder
After that, copy the project folder to C:xampphtdocs.

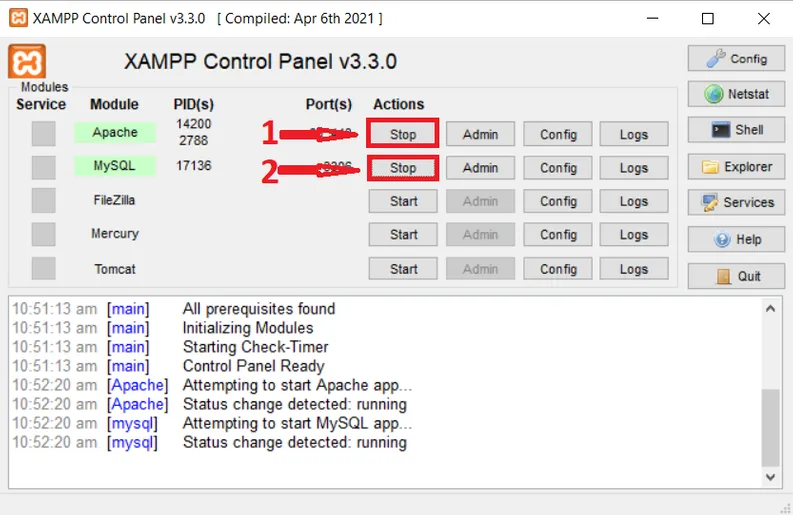
- Step 4: Open Xampp
After that, start apache and mysql with xampp.

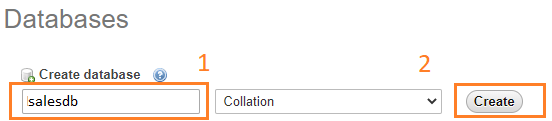
- Step 5: Create Database
Next, open any browser and type localhost/phpmyadmin into the address bar to create a database.

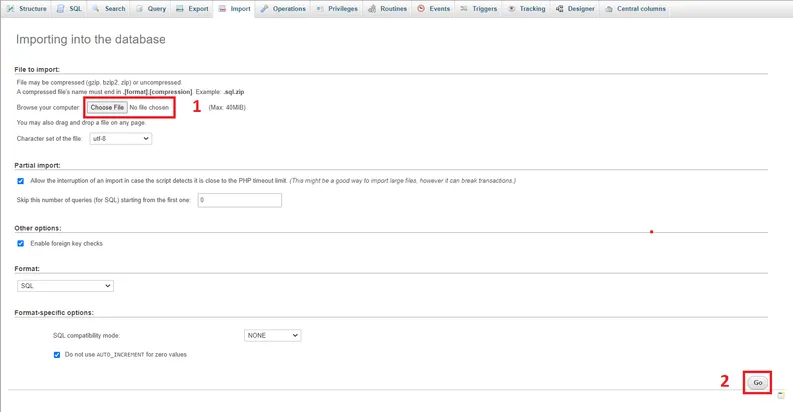
- Step 6: Import Database
After that, go to the right tab and click Import. Then choose File and import the sql file from the download folder.

- Step 7: Execute Project
Finally, go to the localhost/project name.

Download the Source Code below
Summary
For those Web developers interested in learning more about web apps, this system is a fully functional project.
Related Articles
Inquiries
If you have any questions or comments on the program, please leave a comment below.