
The DFD for the School Management System shows the entire “flow” of data on the project. This graphic is used to illustrate the data transformation (input-output) process for project development.
The school management system data flow diagram is made up of DFD levels 0, 1, and 2. It also makes use of entities, processes, and data to define the entire system.
DFD for School Management System: Details
The table provides an overview and details about the DFD school management system (Data Flow Diagram). It contains detailed information about the project.
| Name: | School Management System (DFD) Data Flow Diagram |
| Abstract: | The School Management System Data Flow Diagram (DFD) shows the structure of the project in terms of its data management. It contains the important details on the flow of data and alternatives done in the project. |
| Diagram: | Data Flow Diagram also known as DFD |
| Users: | School Admin, Registrar’s Offices, and Students. |
| Tools Used: | You may use any Diagram tools that provide data flow diagram symbols. |
| Designer: | Sourcecodehero.com |
Definition of School Management System
A school management system is a software platform that assists school administration employees. Many academic and administrative jobs are automated and digitalized. This platform also protects hundreds of sensitive and critical data points.
Moreover, the school management system improves the flow of school information. Proper database administration, also allows their students to update and retrieve their information online easily.
What is School Management System DFD?
The DFD is one of the methods used in the creation of school management systems (data flow diagram). It illustrates the primary processes and options that generate the system’s internal data flow.
Additionally, the data were categorized to show the School Management System structure. Take note that DFD is not part of the School Management System UML Diagrams, but they complement each other in explaining the project activities, behaviors, interactions, and structure.
Importance of Data Flow Diagram (DFD)
The Data Flow Diagram (DFD) for School Management System is important since it shows the developers what is going on in the system. This is accomplished by viewing the data management of the system at multiple levels.
Furthermore, the DFD levels included in the school management system were used to develop the data flow inside the project. These levels contribute to the system’s data flow structural details. This structure will also be the guide for developers in creating the School Management System ER Diagram.
Data flow diagrams not only describe data flow but also the actions needed in moving data from one process to another. As a result, the data was changed from source to destination.
Advantages of Data Flow Diagram:
The Advantages of the School Management System Data Flow Diagram are as follows:
- It is a visual depiction of the system’s contents.
- This information is included in the system documentation file.
- Both programmers and users will find it easy to acquire and comprehend.
- DFDs are diagrams of system components that are thorough and well-explained.
- It also aids in understanding the operation and limitations of a system.
School Management System Data Flow Diagram (DFD)
The example data flow diagram for the school management system is thoroughly explained. The three DFD levels are highlighted in this illustration (DFD Levels 0, 1, and 2).
School Management System DFD Level 0
The context diagram is the Level 0 DFD Diagram for School Management System. Its components include users, the main process, and data flow. The demonstration of the project concept through the single process visualization.
DFD Level 0 represents the entities that interact with a system and establishes the boundary between the system and its surroundings. At a high level, this graphic also illustrates the school management structure.

To set the scene for the project, the illustration shows the main process as a single node. In this context, you can see at a glance how the project works. The user puts information into the system and then gets what it comes up with.
In addition to this, you can see from the diagram that data flow is already happening. Even though the process is very broad, it is clear how data moves through it. Still, just change this diagram to meet the other requirements and add other school management-related things.
School Management System DFD Level 1
The context diagram’s “detonated perspective” is School Management System DFD Level 1. Its purpose is to delve deeper into the concept derived from the context diagram.
Level 1 displays the broader aspects of School Management System DFD Level 0. This is done to clarify the data pathways (flow) and transformation from input to output.

The developed diagrams show four distinct scenarios: student information management, enrollment transaction monitoring, teacher information management, and student year and status checking.
To begin, the data flow begins with students and registrar workers. The system then adapts to the transaction. This concept was inspired by school administration operations or transactions.
You can also see the data storage or database that was used. A database also stores the user’s data inputs. Then it acts as an output source.
School Management System Level 2
Level 2 DFD for School Management System is also the data flow diagram’s highest abstraction. This level further broadens the concept introduced in DFD level 1. It comprises the level 1 sub-processes as well as the data that flows.

However, not all of the project’s processes must have sub-processes. Only use this diagram if it is absolutely necessary. This level is not required if your previous diagrams were clear and precise.
You can add more to this, and how you design your data flow diagram is all up to you. Consider the data flow and be specific with your information.
Data Flow Diagram Notations:
We used DFD notations to define the data flow diagram. They were given in symbols so that they could be easily comprehended. The following are represented by the symbols:
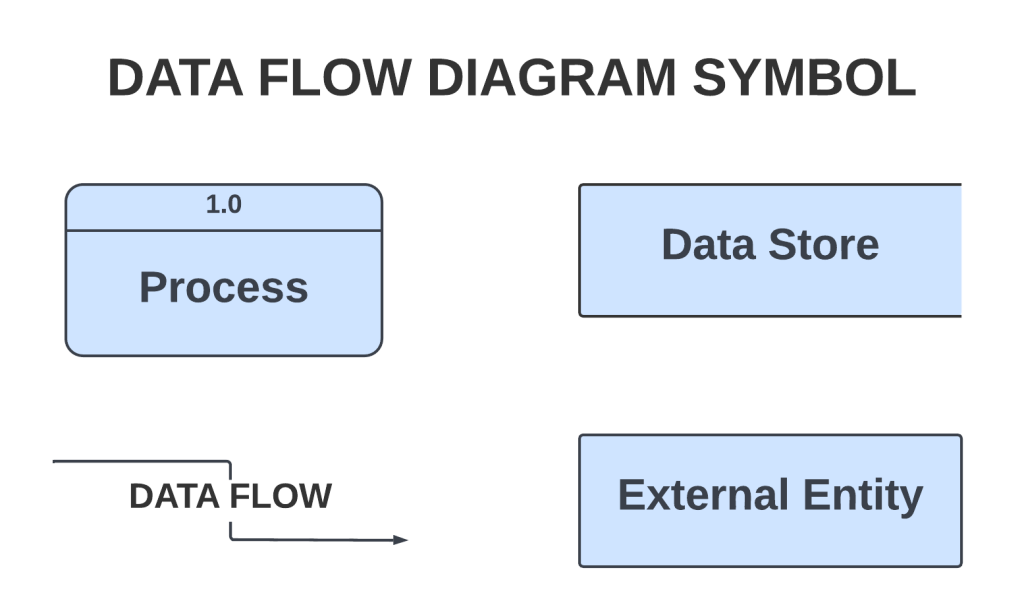
- External Entity: transmits or receives data and interacts with the system. These are the entry and exit points for data entering and leaving the system. Entities may also be a third-party firm or person, an information system, or a business system. Terminators, sources, sinks, and actors are entities.
- Process: is the portion of DFD that modifies and generates output from data. In addition, it does calculations, sorts data based on logic, and controls data flow according to corporate requirements.
- Data Store: A database table and a membership application are examples of files or repositories that store data for future use. Moreover, components are properly labeled.
- Data Flow: data flows between external entities, processes, and data stores. It illustrates the relationship between the other components. It is symbolized by arrows and identified by its data name.
These symbols on the data flow diagram showing how all the data is handled. Using these Data Flow Diagram symbols would also make it easier to point out how the system is built.
How to Create Data Flow Diagram
Time needed: 5 minutes
Here’s the simplest way to create your DFD diagram for Employee Management System.
- Step 1: Familiarize Data Flow Diagram (DFD) Symbols
Data flow diagrams show how information moves through a system or process. Along with data repositories and users, it also includes data inputs and outputs. Before you construct the actual diagram, you must be familiar with its symbols and applications.
- Step 2: Analyze the processes and data included
Analyzation is very important in creating a data flow diagram. It also helps in understanding the meaning of the diagram and avoiding unwanted errors.
The gathered information from the users is very useful in creating the diagram. You also need to evaluate the data and choose the general processes.
From the general processes, you will see the possible data that will enter and exit the system. However, only user data and processes related to the employee management process are included. Then you’re ready for the next step. - Step 3: Plot the Data Flow Diagram
To plot the data flow diagram, you will need the users, processes, databases, and data flows. Then you’ll base the data flow on the evaluated information to have a detailed data flow diagram.
First, you need to identify the users involved and the main processes they will perform. This will first generate the DFD Level 0, or the context Diagram.
Then you will deepen the idea in DFD Level 0. To perform this, you will need to figure out the sub-processes that complete the main process. You will also add a data store that will serve as storage for the processed data.
After that, you will trace the flow or path of data to know the transformations of data inputs into outputs. This will create the DFD Level 1.
Lastly, DFD is done by adding the supporting processes in DFD Level 1. You will connect them to the existing level to give more elaboration to the data flow diagram.
Conclusion:
In conclusion, we have reviewed the knowledge required to design a data flow diagram. Its primary objective is to focus on data transformation from input to output. Indeed, DFD levels were crucial in the development of the system.
In addition, the DFD data were accurately categorized. This emphasizes the organizational framework of human resource management. This documentation will assist with both the project’s basis and its behavior. Check out these linked and suggested articles for more information!
Related Articles:
- DFD for Hostel Management System | Data Flow Diagram
- DFD for Pharmacy Management System | Data Flow Diagram