
In this article, I will give you an idea how to create a Activity Diagram for E-Commerce Website.
Aside from this idea, you can get the e-commerce website, which will be useful for your DBMS studies.
What is Activity Diagram for E-Commerce Website?
The E-Commerce Activity Diagram depicts the behavior of the system by showing the flow of activities from one process to the next.
The order, divide, or continuous flow of activity is all possibilities. Activities, decisions, and pathways make up the E-commerce Activity Diagram. The entire process of the activity diagram is defined by symbols.
E-commerce Website Activity Diagram: Project Name and Details
The table shows the project name and details of activity diagram of e-commerce website. It has the complete information of the project.
| Name: | E-commerce Website Activity Diagram |
| Abstract: | The E-commerce Website Activity Diagram represents the behavior of the project in terms of its activities. It contains the important details on the activities and constraint done in the project. |
| UML Diagram: | Activity Diagram |
| Users: | Admin, Sellers, and Buyers |
| Tools Used: | Diagram tools that provides activity diagram symbols. |
| Designer: | SourceCodeHero.com |
Benefits of E-commerce Website Activity Diagram
The E-commerce Website Activity Diagram Benefits are as follows:
- It aids in the comprehension of the project’s algorithm.
- In a process or workflow, this diagram depicts how users and the system interact.
- To simplify and improve any process, clarify tough use cases.
Activity Diagram for E-commerce
The E-commerce Activity Diagram It is given a website to express its opinions. Its activity graphs are based on its users and are displayed in various settings.
Diagram of E-Commerce Website Activity (Seller Side) – The idea behind an e-commerce is to allow sellers to sell their goods on the site. Customers can then utilize the website to effortlessly access their selected products by simply logging in. Here’s a list of possible activities based on the E-Commerce Website concept. In creating this activity diagram we used lucidchart.
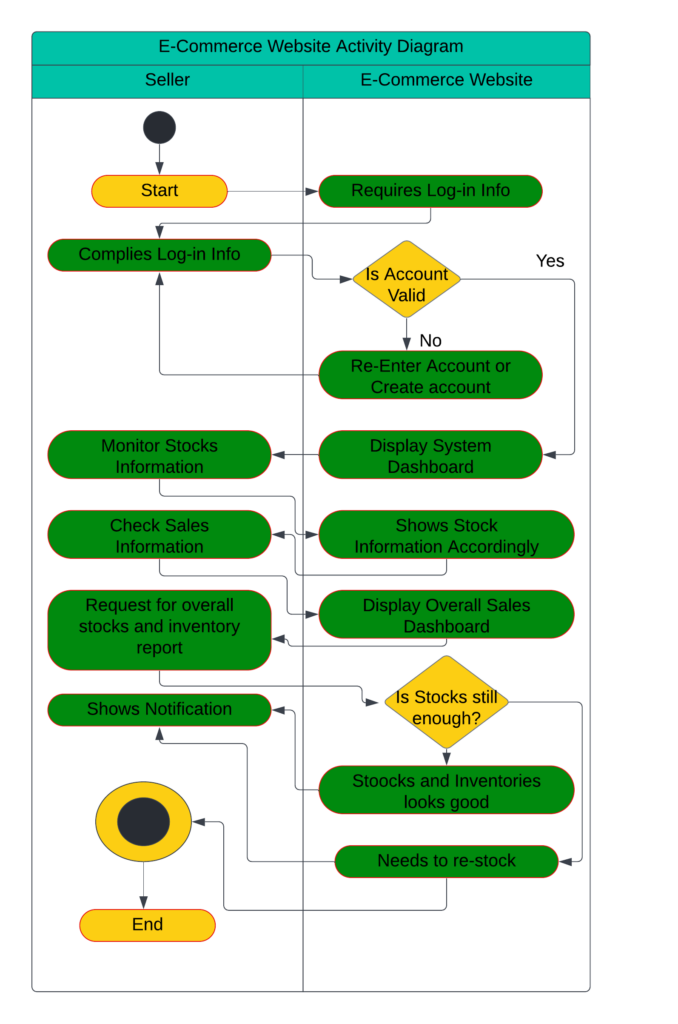
E-Commerce Website

Draw the Activity Diagram for E-Commerce Website
Time needed: 5 minutes
Steps in creating an Activity Diagram for E-Commerce Website.
- Familiarize Activity Diagram Symbols
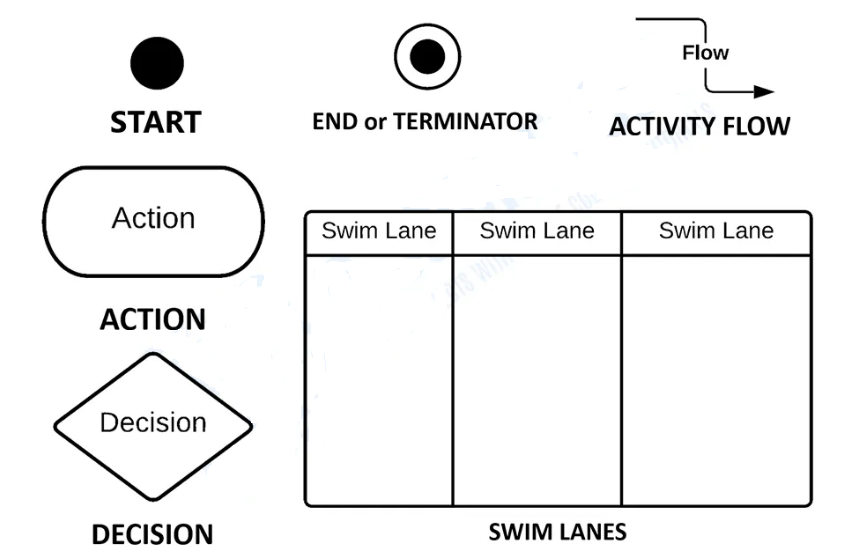
Diagram of an Activity Symbols – are used to generate the Activity Diagram that is seen below. Before you design the Activity Diagram, you must be familiar with their symbols and applications.

- Steps
• Start – is the beginning of the action is symbolized by a filled circle. A dark circle represents the initial node.
• Action – is a stage of an activity in which users or software accomplish a certain task. Actions are represented by round-edged rectangles.
• Decision – represent by a diamond and is used to symbolize a conditional branch in the flow. It has two or more outputs and a single input.
• Swim Lanes – are the lanes drawn as boundaries, and the activities drawn in the same lane as the organization’s activities. Swim lanes must be arranged in a logical order.
• Activity Flow – is another name for the connectors in the diagram that illustrate the flow between processes (activity).
• End or Terminator – is the last phase of the activity. An indicated black circle represents the final node.
Each of these activity diagram symbols shows the overall System behavior. Emphasizing the System’s behavior would be much easier by using these Activity Diagram symbols. - Determine the targeted users
After you’ve familiarized yourself with the symbols, you’ll need to figure out who your target audience is. Your project’s target users will be the ones who use it.
Your users will be the admin, sellers, and buyers if your project is an e-commerce website. You could inquire about the typical behaviors they engage in when completing an assignment involving facial recognition. This information will assist you in taking the next step. - Analyze the activities included
In order to create an activity diagram, you must first analyze the situation. It will assist you in comprehending the diagram’s function and avoiding errors.
The data received from the target consumers is quite valuable when developing an activity diagram. All you have to do now is examine the data and choose the general actions.
You can see the individual activities that are covered in it by looking at the general activities. However, only the necessary activities and decisions (circumstances) relevant to website management are included. Then you’re ready to move on to the next stage. - Plot the Activity Diagram
You’ll need the users, activities, decisions, and their flows to draw the activity diagram (paths). To create a precise Activity Diagram, you will base the flow of activities on the evaluated data.
To create your Activity diagram, start by identifying the users who will be involved and the process they will conduct.
Then, in the course of doing the procedure, place the figured actions or phases.
After that, you’ll follow the flow or sequence of activities to learn about the user/s’ interactions with the system.
Finally, in the plotted diagram, you place the swim lanes or partition to divide the activity of the objects (users and system). This is to determine what activities or choices are under their control or should be carried out.
Conclusion
To summarize, we have discussed about the activity diagram for E-Commerce Website, and how to create an activity diagram for blood bank management and login.
Inquiries
If you have inquiries or suggestions about Activity Diagram for E-commerce, just leave us your comments below. We would be glad to hear to concerns and suggestions and be part of your learning.
Keep us updated and Good day!