In this article, we learn how to make an ER diagram for the User Login Process.
These ER diagram for the user login process illustrates the entity relationships within the database.
This also describes the database or data storage structure of the system.
This is accomplished by identifying the login process entities, their properties, and their relationships.
ER diagrams are used to construct the database for the user login procedure.
Furthermore, this database diagram serves as the true foundation for the system’s data storage, which will serve as the data destination and source.
Login Process ER Diagram: Details
The table shows the overall description of the Login Process ER Diagram. It has a complete overview of the project’s information.
| Name: | User Login Process ER Diagram |
| Abstract: | The user login process ER diagram shows the relationship between various entities. It can be thought of as a blueprint for your system (project) structure. |
| Diagram: | ER Diagram is also known as Entity Relationship Diagram |
| Tools Used: | Diagraming tools that provide ER diagram symbols. |
| Users: | Website, Applications, and Software. |
| Designer: | Sourcecodehero.com |
What is the User Login Process?
A login page is a software interface that requires user identification and authentication, which is often achieved by entering a username and password. Thus, login may offer access to the full system or only a subset.
In addition, SSO is a session and user authentication service that enables access to the system using a single set of login credentials, such as a username and password.
During the login process login is used…
The website’s login form is simple, and users submit their credentials there. The information is thereafter sent to the authentication server, where it is compared against all of the server’s user information.
When a match is detected, the system verifies the user’s identity before granting access to their accounts.
Definition of User Login Process ER Diagram
The ER Diagram of the user login process is referred to as the software database design. This ER Diagram is a graphical representation of the relationships between all system elements.
It consists mostly of Entities, Attributes, and Relationships.
Moreover, ER Diagram is used to build and troubleshoot the System’s relational database. It works best with DFD (Data Flow Diagram), which is responsible for data movement.
Importance of ER Diagram for User Login Process
The importance of an ER diagram for the user login process is that it facilitates the modeling of its data storage or database.
It is the basis for building the database foundation for the project. In addition, this entity-relationship diagram (ERD) helps define the data types to be stored, including their attributes and properties.
Additionally, the ER Diagram describes an entity’s relationships with other entities. ER Diagrams are utilized for all other real-world tasks (database designs).
User Login ER Diagram
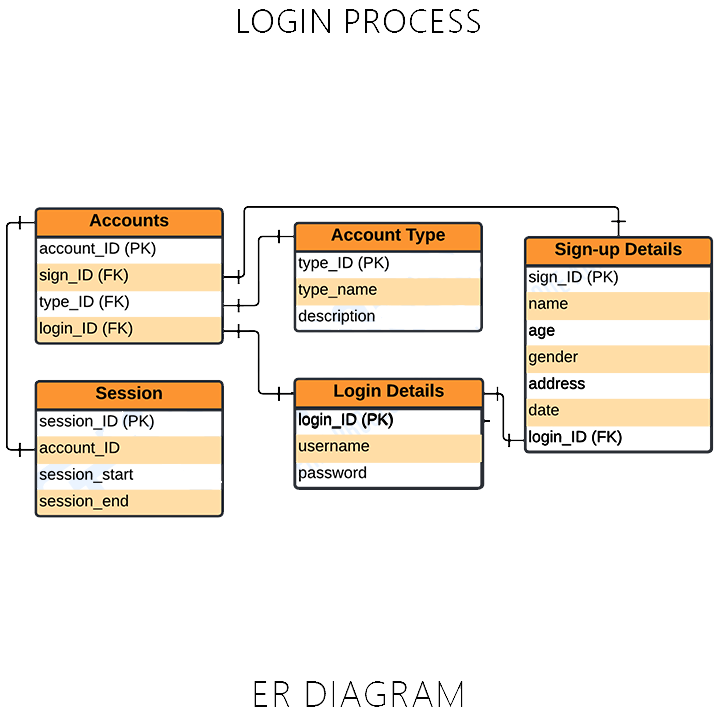
User Login Process Entity Relationship Diagram illustrates the system entity and the supposed functions for each relationship.
Also, it is the project’s alleged database design and describes the information that would be contained in the registration system, its qualities, and its relationship to other information (entity).

The above figure illustrates the entity-relationship model for the login process. It is used to explain how the back end of the project’s database operates.
The tables are designed to match the system’s specifications and provide far more particular information about each entity.
ER Diagram for User Login Process Tables
The tables below provide the complete database table details such as Field Name, Descriptions, data types, and character lengths.
Table Name: Accounts
| Field | Description | Type | Length |
| account_ID (PK) | Account ID | Int | 11 |
| sign_ID (FK) | Sign-up ID | Int | 11 |
| type_ID (FK) | Type ID | Int | 11 |
| login_ID (FK) | Login ID | Int | 11 |
Table Name: Session
| Field | Description | Type | Length |
| session_ID (PK) | Face ID | Int | 11 |
| account_ID (FK) | Student ID | Int | 11 |
| session_start | Session Start | Varchar | 255 |
| session_end | Session End | Varchar | 255 |
Table Name: Account Type
| Field | Description | Type | Length |
| type_ID (PK) | Account Type ID | Int | 11 |
| type_name | Type Name | Varchar | 255 |
| description | Description | Text |
Table Name: Login Details
| Field | Description | Type | Length |
| login_ID (PK) | Login ID | Int | 11 |
| username | Username | Varchar | 255 |
| password | Password | Varchar | 255 |
Table Name: Signup Details
| Field | Description | Type | Length |
| sign_ID (PK) | Sign-up ID | Int | 11 |
| name | Name | Varchar | 255 |
| age | Age | Int | 11 |
| gender | Gender | Varchar | 255 |
| address | Address | Text | |
| date | Date | Date | |
| login_ID (FK) | Login ID | Int | 11 |
ER Diagram for User Login Process [PDF]
The ER Diagram for User Login Process PDF contains information on the database’s principles.
You may use this information for your senior thesis. You can also utilize it directly or edit its content based on the needs of your project.
How to create an ER Diagram for the User Login Process with Cardinality Ratio
Time needed: 5 minutes
Steps in building the ER Diagram for User Login Process with Cardinality Ratio.
- Step 1: Familiarize the ER Diagram (Entity Relationship Diagram) Symbols and Cardinality
Entity Relationship Diagram – illustrates the data structure of a project.
It uses symbols to clarify its components and their interactions. Before constructing the ER Diagram, you must become familiar with its symbols and applications. - Step 2: Finalize the entities included
Begin the creation of your ER Diagram by finalizing the entities required for your login process.
This entity is represented by a rectangle, and you should leave plenty of space in your design for their addition in the next phases. - Step 3: Add the attributes of each entity
After finalizing the entities, think about the qualities you’ll need to characterize each entity.
The details of the various entities outlined in a conceptual ER diagram are supplied as attributes. - Step 4: Describe the relationships (cardinality) between entities and attributes
To plot relationships between the ERD you will need the entities, their attributes, and relationships.
You will base the data structure on the evaluated information to have the exact Entity Relationship Diagram.
Conclusion:
In Summary, the User Login Process ER diagram is used to design and develop the User Login System.
- It helps to create a fully functional system.
- It helps to create and perceive the back end of the system or software.
- It holds the data that enter and exit the system.
Inquiries
If you have inquiries or suggestions about the ER Diagram for the Login Process, just leave us your comments below. We would be glad to know to concerns and suggestions and be part of your learning.
Keep us updated and Good day!
